-
PDF
- Split View
-
Views
-
Cite
Cite
Yayoi Taniguchi, Naohiko Takahashi, Akira Fukui, Yasuko Nagano-Torigoe, Luong Cong Thuc, Yasushi Teshima, Tetsuji Shinohara, Osamu Wakisaka, Tatsuhiko Ooie, Yukichi Murozono, Kunio Yufu, Mikiko Nakagawa, Masahide Hara, Hironobu Yoshimatsu, Tetsunori Saikawa, Candesartan restored cardiac Hsp72 expression and tolerance against reperfusion injury in hereditary insulin-resistant rats, Cardiovascular Research, Volume 92, Issue 3, 1 December 2011, Pages 439–448, https://doi.org/10.1093/cvr/cvr254
Close - Share Icon Share
Abstract
We tested the hypothesis that candesartan, an angiotensin II (AII) type 1 receptor antagonist, would restore the depressed phosphatidylinositol 3 (PI3) kinase-dependent Akt phosphorylation, an essential signal to induce heat-shock protein 72 (Hsp72) in response to hyperthermia, in Otsuka Long–Evans Tokushima fatty (OLETF) rats.
At 14 weeks of age, male OLETF rats and Long–Evans Tokushima Otsuka (LETO) rats were treated with candesartan (0.25 mg/kg/day) for 2weeks. Thereafter, hyperthermia (43°C for 20 min) was applied. We observed the following: (i) Candesartan did not improve insulin sensitivity in OLETF rats. (ii) Candesartan restored depressed PI3 kinase-dependent Akt phosphorylation and Hsp72 expression in OLETF rat hearts. (iii) Cardiac ventricular tissue contents of AII were greater in OLETF rats, which were suppressed by candesartan. (iv) Cardiac levels of phosphatase and tensin homologue deleted on chromosome 10 (PTEN) phosphorylation were greater in OLETF rats, which were suppressed by candesartan. In cultured cardiomyocytes, application of AII induced PTEN phosphorylation, which was suppressed by candesartan. (v) In high-fat diet insulin-resistant rats, similar results were observed with respect to Hsp72 expression, Akt phosphorylation and PTEN phosphorylation. (vi) In isolated, perfused heart experiments, reperfusion-induced cardiac functional recovery was suppressed in OLETF rat hearts, which was improved by candesartan.
Our results suggest that the depression of PI3 kinase-dependent Akt activation in response to hyperthermia in OLETF rats can be restored by candesartan. Substantial activation of the renin–angiotensin system, represented by increased myocardial AII content and subsequent PTEN phosphorylation, may underlie the pathogenesis which is ameliorated by candesartan.
1. Introduction
Heat-shock protein 72 (Hsp72) has been reported to be involved predominantly in cardioprotection.1–4 We have recently demonstrated that phosphatidylinositol 3 (PI3) kinase-dependent Akt activation, an essential signal for Hsp72 expression in response to hyperthermia (HT), is depressed in the hearts of insulin-resistant Otsuka Long–Evans Tokushima fatty (OLETF) rats, and that treatment with pioglitazone for 4 weeks restored the impaired cascade to induce Hsp72 expression and improve reperfusion-induced cardiac performance in OLETF rats in association with an improvement in insulin sensitivity.5
Insulin sensitivity has reportedly been improved by antagonism of the renin–angiotensin system.6–8 Accordingly, it is interesting from the clinical viewpoint to evaluate the effects of an angiotensin II (AII) type 1 (AT1) receptor antagonist on Hsp72 expression in OLETF rat hearts. In contrast, phosphorylation of phosphatase and tensin homologue deleted on chromosome 10 (PTEN) negatively regulates PI3 kinase-dependent Akt phosphorylation.9 As AII reportedly triggers PTEN phosphorylation,10 it is conceivable that blockade of AII signals in insulin-resistance animals restored the PI3 kinase/Akt pathway to restore Hsp72 expression. However, no information is available in this regard. In the present study, therefore, we hypothesized that treatment with candesartan, an AT1 receptor antagonist, for 2 weeks would restore the depressed PI3 kinase-dependent Akt activation in response to HT to induce Hsp72 expression, which is associated with protection against ischaemia–reperfusion injury in the hearts of OLETF rats.
2. Methods
The investigation was carried out in accordance with the Guide for the Care and Use of Laboratory Animals published by the US National Institutes of Health (NIH publication number 85-23, revised 1996). The study protocol was approved by the institutional review board of Oita University.
2.1 Materials
Antibody to mouse Hsp72 was purchased from Stressgen Biotechnologies Corp., Victoria, BC, Canada. Antibodies to Akt and phospho-Ser473-Akt, and antibodies to PTEN and phospho-Ser380-PTEN were purchased from Cell Signaling Technology, Danvers, MA, USA. Antibodies to AT1 receptor, AII type 2 (AT2) receptor, and glucose transporter type 4 (GLUT4) were purchased from Santa Cruz Biotechnology, Santa Cruz, CA, USA. Horseradish peroxidase-tagged secondary antibodies and enhanced chemiluminescence reagents were purchased from Amersham Pharmacia Biotech, Piscataway, NJ, USA. Bradford protein assay kits were purchased from Bio-Rad, Hercules, CA, USA. Wortmannin and other chemical agents were purchased from Sigma Chemical Co., St. Louis, MI, USA. Candesartan was provided by Takeda Pharmaceutical Company, Osaka, Japan.
2.2 Animals
Four-week-old male OLETF rats were provided by the Animal Center of Tokushima Research Institute of Otsuka Pharmaceuticals. Age-matched Long–Evans Tokushima Otsuka (LETO) rats, which do not develop insulin resistance, were used as normal control animals. All rats were housed in a room illuminated daily from 07.00 to 19.00 h (12 h–12 h light–dark cycle) with the temperature maintained at 21 ± 1°C. At 14 weeks of age, each group of OLETF (n = 130) and LETO rats (n = 130) was divided into two subgroups. In the candesartan-treated groups (OLETF-CAN and LETO-CAN groups), candesartan (0.25 mg/kg/day) was given intraperitoneally (i.p.) by an osmotic mini-pump (Alzet model 2002; Alza Co., Cupertino, CA, USA) for 2 weeks. In the control groups (OLETF-VEH and LETO-VEH groups), the same volume of vehicle solution was administered. Systolic blood pressure (SBP) was measured by the non-invasive tail-cuff method (MK-1000; Muromachi Kikai Co., Ltd, Tokyo, Japan). At 16 weeks of age, each rat was lightly anaesthetized with pentobarbital sodium (20 mg/kg i.p.) and subjected to HT (43°C for 20 min) or normothermia (NT; 37°C for 20 min), as described previously.5 Briefly, rats were placed with their heads on a pillow (to avoid aspiration of water) for 20 min in a bath in which the water temperature was maintained at 43°C. The rectal temperature was monitored throughout the thermo-treatment experiments. In addition, some rats of each group were injected with wortmannin (16 μg/kg intravenously) or saline into a tail vein 15 min before each thermal treatment. Twenty-four hours after thermal treatment, pentobarbital sodium (50 mg/kg i.p.) was administered. Following the confirmation of disappearance of eyelid reflex in association with markedly depressed respiration, rat hearts were isolated and prepared for western blot analysis or isolated, perfused heart experiments.
In addition, male Sprague–Dawley rats, 12 weeks of age, were housed in the same conditions. They received orally either a normal chow diet (Clea C; Nippon Clea, Tokyo, Japan; CNT group) or a high-fat diet (HiF group). The normal chow consisted of 10% fat, 70% carbohydrates, and 20% protein, while the high-fat diet consisted of 45% fat, 35% carbohydrates, and 20% protein.11 After 6 weeks on the respective diet, the animals were treated with candesartan or vehicle for 2 weeks. We have previously demonstrated that feeding of a high-fat diet for 6 weeks resulted in the development of insulin resistance and hyperinsulinaemia.11
2.3 Primary culture of neonatal rat cardiac ventricular myocytes
Cardiac ventricular myocytes were obtained from 1- to 3-day-old Sprague–Dawley rats and cultured as described elsewhere.12 Angiotensin II (100 μM) was loaded with or without pre-treatment with 100 nM candesartan for 5 h. The medium was changed to fetal bovine serum-free Dulbecco's modified Eagle's medium 12 h before the experiment.
2.4 Oral glucose tolerance test (OGTT)
At 16 weeks of age, OGTT was performed after an overnight fast. A glucose solution (2 g/kg) was administered orally, and blood was drawn from the tail vein at 0, 30, 60, 90, and 120 min. The plasma glucose concentrations were measured with a commercial test kit (GR-102; Terumo, Tokyo, Japan). The plasma insulin concentrations were quantified using an ELISA insulin kit (Morinaga Seikagaku Co., Yokohama, Japan).
2.5 Plasma and tissue AII concentration assays
Plasma AII concentrations were measured by RIA using two antibodies specific for AII (Perkin-Elmer Life & Analytical Sciences, Waltham, MA, USA). Cardiac ventricular tissue AII contents were measured by an EIA kit (Phoenix Pharmaceuticals, Inc., Burlingame, CA, USA).
2.6 Western blot analysis
Western blot analysis was performed as previously described.5 Each heart was removed rapidly and frozen in liquid nitrogen. The frozen tissues were homogenized with lysis buffer. The homogenate was centrifuged at 1400 g for 20 min. The pellet, which contained mainly unhomogenized pieces of tissue, was discarded, and the supernatant was centrifuged at 9000 g for 60 min. The 9000 g pellet was resuspended in lysis buffer. The supernatant was centrifuged at 180 000 g for 90 min. The plasma membrane fraction in the pellet was resuspended, loaded on a 10–30% (w/w) continuous sucrose gradient and centrifuged at 125 000 g for 90 min. The cytosolic fraction was obtained from the sucrose layer first. The concentration of protein was measured by the Bradford method.13 An equal amount of total protein in each fraction was subjected to SDS–PAGE, and transferred electrophoretically onto a polyvinylidene fluoride membrane. After blocking, the membranes were incubated with antibodies. After repeated washing, the membranes were incubated with secondary antibodies. The proteins were detected by enhanced chemiluminescence following exposure to Hyperfilm. The amount of protein on the immunoblots was quantified using National Institute of Health image analysis software.
2.7 Translocation of GLUT4
Regular insulin (Eli Lilly, Indianapolis, IN, USA) was given as a dose of 10 U/kg via the tail vein. After 20 min, the heart was immediately excised, washed in distilled water to remove blood, and stored at −70°C until membrane isolation. Membrane fractions of rat hearts were prepared as described previously.14 Homogenates were centrifuged at 100 g for 10 min and then 5000 g for 10 min to prepare a plasma membrane fraction. The GLUT4 content in plasma membrane fractions was measured by western blot analysis.
2.8 Isolated, perfused heart experiments
Isolated, perfused heart experiments using a Langendorff apparatus were performed as previously described.5 Twenty-four hours after HT or NT, the heart was isolated and retrogradely perfused with Krebs–Henseleit buffer (pH 7.4) equilibrated with a gas mixture of 95% O2–5% CO2 at 36.5°C at a constant pressure of 75 mmHg. A water-filled latex balloon was inserted through the mitral valve orifice into the left ventricle (LV), and the LV end-diastolic pressure was adjusted to 0 mmHg. During the initial 10 min of constant-pressure perfusion, the flow rate of the perfusate was determined for each heart, which was then perfused at a determined rate using a microtube pump while the heart was covered with water-jacketed glassware and the relative humidity was maintained at 90% or more. No-flow global ischaemia was introduced for 20 min, followed by reperfusion for 30 min. The coronary effluent during the 30 min reperfusion period was collected for measurement of creatine kinase content (released CK). The CK activity was determined as previously reported.15 The ratio of released CK to LV weight was calculated. Left ventricular pressure was monitored and LV developed pressure (LVDP) was defined as the difference between the LV systolic and diastolic pressures. The LV pressure, coronary perfusion pressure, and ECG were recorded continuously on a polygraph recorder (WS-681G; Nihon Kohden, Tokyo, Japan) and stored on a PCM data recorder (RD-111T; TEAC, Tokyo, Japan) for later analysis.
2.9 Statistical analysis
Data are expressed as the means ± SEM. Serial changes in blood pressure, plasma concentrations of glucose and insulin during OGTT, and haemodynamic parameters during the reperfusion period were analysed by two-way analysis of variance (ANOVA) followed by the Bonferroni–Dunn test. Comparison of physiological, serum, and tissue parameters, including AII concentrations, the relative intensity of each protein, and the ratio of released CK to LV weight were analysed using one-way ANOVA, followed by the Bonferroni–Dunn test. A P-value <0.05 was considered statistically significant.
3. Results
3.1 Physical and metabolic parameters
Table 1 summarizes the physical and metabolic parameters after overnight fasting in the LETO and OLETF rats after 2weeks of treatment with vehicle or candesartan. When compared with the LETO-VEH group, the body weight and LV weight were greater in the OLETF-VEH group (P< 0.001 for each). Neither LV weight/body weight nor LV weight/tibia length was different between the two groups. Although the plasma glucose concentrations were not significantly different, the plasma insulin concentrations were higher in the OLETF-VEH group than in the LETO-VEH group (P < 0.01). With regard to the indices reflecting lipid metabolism, although the total cholesterol concentration was not significantly different, the concentrations of plasma triglycerides and free fatty acids were higher in the OLETF-VEH group than in the LETO-VEH group (P < 0.05 and P < 0.001, respectively). Two weeks of treatment with candesartan did not influence any physical or metabolic parameters in the LETO or OLETF rats.
Basic characteristics of experimental groups after treatment for 2 weeks with vehicle (VEH) or candesartan (CAN)
| . | LETO-VEH (n = 8) . | LETO-CAN (n = 8) . | OLETF-VEH (n = 8) . | OLETF-CAN (n = 8) . |
|---|---|---|---|---|
| Body weight (g) | 396.3 ± 4.6 | 386.4 ± 6.4 | 426.3 ± 4.1** | 426.5 ± 4.4**†† |
| Left ventricular weight (g) | 0.95 ± 0.01 | 0.94 ± 0.01 | 1.07 ± 0.02** | 1.05 ± 0.02**†† |
| Left ventricular weight/body weight (mg/g) | 2.40 ± 0.04 | 2.44 ± 0.04 | 2.50 ± 0.03 | 2.45 ± 0.03 |
| Left ventricular weight/tibia length (mg/mm) | 22.1 ± 1.1 | 21.9 ± 0.4 | 22.7 ± 1.0 | 22.6 ± 0.9 |
| Plasma glucose (mmol/L) | 4.93 ± 0.19 | 4.69 ± 0.38 | 5.55 ± 0.35 | 5.31 ± 0.24 |
| Plasma insulin (ng/mL) | 2.42 ± 0.09 | 2.12 ± 0.01 | 4.20 ± 0.52** | 4.54 ± 0.69**†† |
| Total cholesterol (mg/dL) | 71.5 ± 1.9 | 74.4 ± 1.3 | 62.8 ± 6.2 | 68.5 ± 4.6 |
| Triglycerides (mg/dL) | 32.9 ± 4.9 | 43.5 ± 4.9 | 61.0 ± 6.3** | 53.6 ± 8.8† |
| Free fatty acids (mg/dL) | 482.1 ± 39.0 | 458.4 ± 25.2 | 992.4 ± 103.6* | 959.6 ± 80.5*†† |
Data are presented as the means ± SEM.
*P < 0.05.
**P < 0.01 vs. corresponding LETO groups.
†P < 0.05, ††P < 0.01 vs. OLETF-VEH group.
3.2 Systolic blood pressure
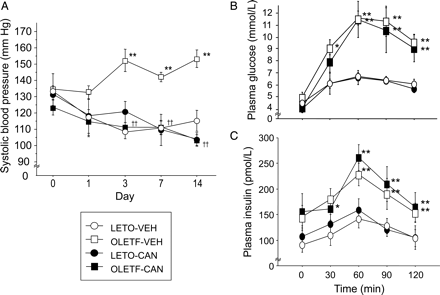
Figure 1A plots the SBP before and during the treatment period with vehicle or candesartan in LETO and OLETF rats. The SBP did not show a significant difference among the four groups before treatment. In LETO rats, no changes in SBP were observed, and candesartan did not influence the SBP. In OLETF rats, however, a spontaneous elevation of SBP was observed on and after day 3 (P < 0.01 by ANOVA). The increase in SBP was suppressed by the treatment with candesartan (P < 0.01 by ANOVA).
Systolic blood pressure during the 2 week treatment (A). Blood glucose (B) and plasma insulin concentrations (C) during oral glucose tolerance test. *P < 0.05, **P < 0.01 vs. corresponding LETO groups. ††P < 0.01 vs. corresponding vehicle-treated group. n = 9 for each group. Data are means ± SEM. CAN, candesartan; VEH, vehicle.
3.3 Oral glucose tolerance test
Figure 1B and C, respectively, plot the plasma glucose and insulin concentrations during the OGTT. The increase in plasma glucose and insulin in response to oral glucose was more pronounced in the OLETF-VEH group than in the LETO-VEH group (P < 0.05 and P < 0.01, respectively, by ANOVA). Treatment with candesartan did not influence the levels of plasma glucose or insulin in the LETO and OLETF rats.
3.4 Cardiac Hsp72 expression
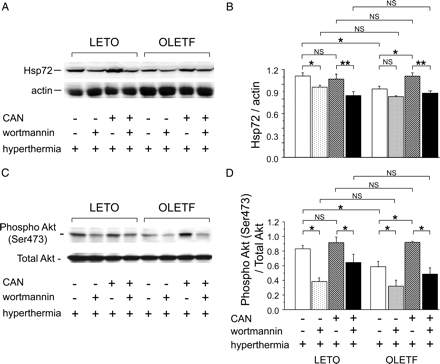
Figure 2A and B depict the cardiac Hsp72 expression 24 h after HT treatment. As we previously reported,5,16 there was no significant difference in the basal expression of Hsp72 between the LETO and OLETF groups (data not shown). In both groups, HT induced Hsp72 expression. However, the HT-induced Hsp72 expression in the OLETF-VEH group was less than that in the LETO-VEH group (P < 0.05). Treatment with candesartan restored HT-induced Hsp72 expression in the OLETF group (OLETF-CAN group), resulting in no significant difference between the LETO-CAN and OLETF-CAN groups. Pre-treatment with wortmannin inhibited HT-induced expression of Hsp72 in the LETO groups, irrespective of treatment with candesartan. The significantly improved Hsp72 induction observed after candesartan treatment (OLETF-CAN group) was abolished by pre-treatment with wortmannin (P < 0.01), while the depressed cardiac Hsp72 expression in the OLETF-VEH group was not significantly influenced by pre-treatment with wortmannin.
Cardiac expression of Hsp72 and phosphorylated Akt. Representative immunoblot bands (A) and quantification of the ratio of Hsp72 to actin (B). Representative immunoblot bands (C) and quantification of the ratio of phospho-Akt to total Akt (D). n = 7 for each group. Data are shown as the means + SEM. *P < 0.05, **P < 0.01. CAN, candesartan; NS, not significant.
3.5 Cardiac Akt phosphorylation
Figure 2C and D depict the Akt phosphorylation 1 h after exposure to HT. As we previously demonstrated,5,16 there was no significant difference in the basal Akt phosphorylation between the LETO and OLETF groups (data not shown). In both groups, HT induced Akt phosphorylation. However, the Akt phosphorylation induced by HT in the OLETF-VEH group was less than that in the LETO-VEH group (P < 0.05). Treatment with candesartan restored Akt phosphorylation in the OLETF-CAN group, resulting in no significant difference between the two groups. Hyperthermia-induced Akt phosphorylation was suppressed by pre-treatment with wortmannin in each group (P < 0.05 for each).
3.6 Plasma and cardiac ventricular AII concentrations, and cardiac expression of AT1 and AT2 receptors
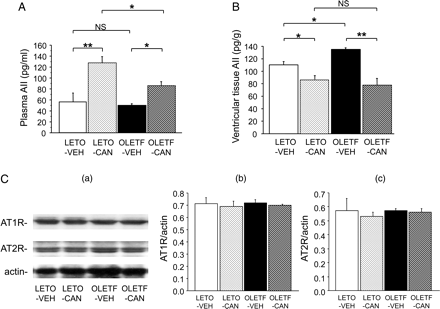
Figure 3A indicates the plasma AII concentrations. Before treatment with candesartan or vehicle, there was no significant difference in the plasma AII concentration between the LETO-VEH and OLETF-VEH groups. Treatment with candesartan increased plasma AII concentrations in both groups, and the increase was more pronounced in the LETO group (P < 0.05). Figure 3B shows the cardiac ventricular tissue AII contents. The ventricular AII content was greater in the OLETF-VEH group than in the LETO-VEH group (P < 0.05). Treatment with candesartan decreased the ventricular AII concentration in the LETO (P < 0.05) and OLETF groups (P < 0.01) to comparable levels. Figure 3C depicts the cardiac expression of AT1 and AT2 receptors. The expressions did not show any significant differences between the two groups before treatment. Treatment with candesartan did not influence the levels of expression in the two groups.
Plasma (A) and cardiac ventricular angiotensin II (AII) concentrations (B). (C) Cardiac expression of angiotensin II type 1 receptor (AT1R) and AT2 receptor (AT2R) in the LETO and OLETF rats. Representative immunoblot bands (a) and quantification of the ratio of AT1R (b) and AT2R (c) to actin. n = 7 for each group. Data are shown as the means + SEM. *P < 0.05, **P < 0.01. CAN, candesartan; NS, not significant; VEH, vehicle.
3.7 Insulin signalling and GLUT4 translocation
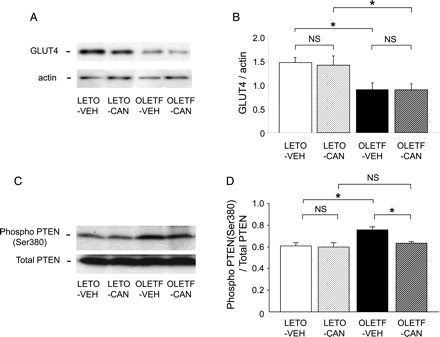
Figure 4A and B show the representative immunoblot band of GLUT4 in plasma membrane fractions and quantification of the ratio of GLUT4 to actin. As shown, membranous GLUT4 expression in response to insulin injection was depressed in OLETF rat hearts compared with LETO rat hearts (P < 0.05). Treatment with candesartan did not influence GLUT4 expression level.
Immunoblots of GLUT4 in plasma membrane fractions from hearts frozen after insulin injection (A and B). Representative immunoblot bands (A) and quantification of the ratio of GLUT4 to actin (B). n = 5 for each group. Cardiac expression of phosphorylated (phospho)-Ser380-PTEN and total PTEN (C and D). Representative immunoblot bands (C) and quantification of the ratio of phospho-PTEN to total PTEN (D). n = 7 for each group. Data are shown as the means + SEM. *P < 0.05. CAN, candesartan; NS, not significant; VEH, vehicle.
3.8 Cardiac expression of the phosphorylated form of PTEN
Figure 4C and D show the levels of myocardial expression of the phosphorylated form of PTEN 24 h after HT. When compared with the LETO-VEH group, the levels of PTEN phosphorylation were greater in the OLETF-VEH group (P < 0.05). Treatment with candesartan for 2 weeks did not influence the PTEN phosphorylation in the LETO group; however, candesartan suppressed the enhanced levels of PTEN phosphorylation in the OLETF group (P < 0.05).
3.9 Reperfusion-induced LV functional recovery and released CK
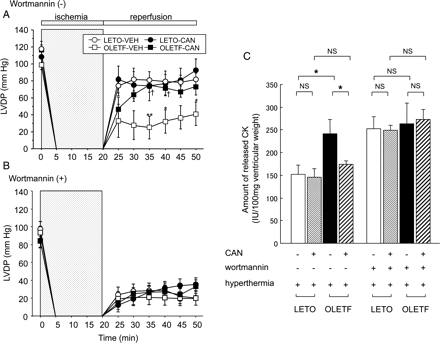
Figure 5A illustrates the serial changes in LVDP during the experimental period. Heart rate and coronary perfusion pressure did not show a significant difference among the four experimental groups during the baseline period (data not shown). During no-flow global ischaemia, LVDP decreased rapidly to zero. During the reperfusion period, the recovery of LVDP in the OLETF-VEH group was less compared that that in the LETO-VEH (P < 0.01 by ANOVA). The treatment with candesartan, however, improved LV functional recovery in the OLETF group (P < 0.01 by ANOVA), resulting in no significant difference between the LETO-CAN and OLETF-CAN groups. As shown in Figure 5B, pre-treatment with wortmannin abolished the reperfusion-induced LV functional recovery in the LETO-VEH, LETO-CAN, and OLET-CAN groups to levels comparable to the OLET-VEH group.
Serial changes in left ventricular developed pressure (LVDP) during the experimental period. No-flow global ischaemia was introduced for 20 min, followed by reperfusion for 30 min. Hyperthermia was applied after saline (A) or wortmannin pre-treatment (B). n = 7 for each group. Data are the means ± SEM. *P < 0.05, **P < 0.01 vs. corresponding LETO groups, †P < 0.05 vs. corresponding vehicle-treated groups. (C) Amount of released creatine kinase (CK) relative to ventricular weight during the 30 min reperfusion period. n = 7 for each group. Data are shown as the means + SEM. *P < 0.05. CAN, candesartan; NS, not significant; VEH, vehicle.
Figure 5C shows the amount of CK released during the 30 min of reperfusion period. As we previously reported,5,16 in normothermia, the amount of released CK was greater in the OLETF-VEH group than in the LETO-VEH group (P < 0.05, data not shown). In rats treated with HT, the amount of released CK was greater in the OLETF-VEH group than in the LETO-VEH group (P < 0.05). Treatment with candesartan reduced the value (P < 0.05), resulting in no significant difference between the LETO-CAN and OLETF-CAN groups. Pre-treatment with wortmannin increased the amount of CK released in the LETO-VEH, LETO-CAN, and OLET-CAN groups to levels comparable to the OLET-VEH group.
3.10 Observations in rats fed a high-fat diet
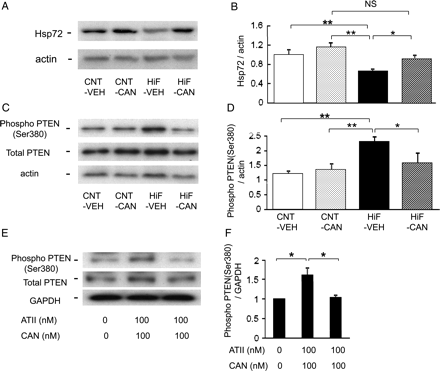
Feeding a high-fat diet for 6 weeks resulted in greater levels of plasma glucose when compared with a normal diet (133.2 ± 6.1 vs. 110.0 ± 4.1 mg/dL, respectively, P < 0.05). As shown in Figure 6A and B, the HT-induced Hsp72 expression in the HiF-VEH group was less than that in the CNT-VEH group (P < 0.05). Treatment with candesartan restored HT-induced Hsp72 expression in the HiF group (HiF-CAN group). As shown in Figure 6C and D, when compared with the CNT-VEH group, the levels of PTEN phosphorylation were greater in the HiF-VEH group (P < 0.05). Treatment with candesartan for 2 weeks did not influence the PTEN phosphorylation in the LETO group; however, candesartan suppressed the enhanced levels of PTEN phosphorylation in the HiF group (P < 0.05).
(A–D) Cardiac expression of Hsp72 and phosphorylated PTEN in hearts of rats fed a high-fat diet. Representative immunoblot bands (A) and quantification of the ratio of Hsp72 to actin (B). Representative immunoblot bands (C) and quantification of phosphorylated PTEN (D). Data are shown as the means + SEM. n = 5 for each group. (E and F) Expression levels of the phosphorylated form of PTEN 24 h after hyperthermia in cultured cardiomyocytes. Data are shown as the means + SEM. n = 5 for each group. *P < 0.05. CAN, candesartan; NS, not significant; VEH, vehicle.
3.11 Effects of AII on PTEN expression in rat cultured cardiomyocytes
Figure 6E and F shows the expression levels of cultured cardiomyocytes of the phosphorylated form of PTEN 24 h after HT. When compared with the vehicle-treated cells, the levels of PTEN phosphorylation were greater in the AII-treated cells (P < 0.05). Pre-treatment with candesartan did not influence the PTEN phosphorylation in the vehicle-treated cells; however, candesartan suppressed the enhanced levels of PTEN phosphorylation in the AII-treated cells (P < 0.05).
4. Discussion
The core findings of the present study were as follows. (i) Candesartan did not improve insulin sensitivity in OLETF rats. (ii) Candesartan restored depressed PI3 kinase-dependent Akt phosphorylation and Hsp72 expression in OLETF rat hearts. (iii) Cardiac ventricular tissue contents of AII were greater in OLETF rats, which were suppressed by candesartan. (iv) Cardiac levels of PTEN phosphorylation were greater in OLETF rats, which were suppressed by candesartan. In cultured cardiomyocytes, application of AII induced PTEN phosphorylation, which was suppressed by candesartan. (v) In insulin-resistant rats on a high-fat diet, similar results were observed with respect to Hsp72 expression, Akt phosphorylation, and PTEN phosphorylation. (vi) In isolated, perfused heart experiments, reperfusion-induced cardiac functional recovery was suppressed in OLETF rat hearts, which was improved by candesartan. As candesartan increased HT-induced cardiac Hsp72 expression in OLETF rats, but not in LETO rats, it is suggested that candesartan improved the pathogenesis for the depressed cardiac expression of Hsp72 in OLETF rat hearts.
What are the mechanisms for such restoration by candesartan? There have been very few reports describing the effects of pharmacological inhibition of the renin–angiotensin system on Hsp72 expression. Tanonaka et al.17 reported that the lack of production of myocardial Hsp72 induced by HT in rats with chronic heart failure following coronary artery ligation was reversed by an 8 week treatment protocol with trandolapril, an angiotensin-converting enzyme inhibitor, and was associated with improved cardiac contractile function. The same group also reported changes in the level of Hsp60 in the failing heart, which was restored by trandolapril.18 However, these reports did not demonstrate the mechanisms of the effects of trandolapril on recovery of Hsp expression.17,18 In fact, they suggested that it remained unclear whether the recovery of Hsp72 induction was the cause or effect of treatment with trandolapril.17 In our study, the expression of neither the AT1 nor the AT2 receptor was different between the OLETF and LETO rats. The plasma AII concentrations were increased by candesartan, which was more pronounced in LETO rats than in OLETF rats. However, the levels of plasma AII before treatment were not different between the two groups. Thus, the depressed Hsp72 expression observed in OLETF rat hearts cannot be explained by the plasma AII concentration. In contrast, the ventricular tissue contents of AII were greater in the OLETF rats compared with the LETO rats before treatment. This increase in tissue AII was clearly suppressed by the treatment with candesartan, to levels comparable between the two groups. Based on these observations, it can be postulated that excessive myocardial AII contents might suppress PI3 kinase-dependent Akt phosphorylation in response to HT in OLETF rats.
In the present study, LV hypertrophy was not evident in OLETF rat hearts. However, higher levels of both SBP and ventricular tissue AII content suggest substantial activation of the renin–angiotensin system in OLETF rats. In fact, it was previously reported that 46-week-old OLETF rats had greater LV weight/body weight compared with age-matched LETO rats, and that cilazapril, an angiotensin-converting enzyme inhibitor, ameliorated the LV hypertrophy in OLETF rats.19 Taken together, the process of hypertrophy due to substantial activation of the renin–angiotensin system was likely to be initiated in 14-week-old OLETF rat hearts, in which candesartan effectively reduced ventricular tissue AII content. In this regard, it has been revealed that PTEN is constitutively active and considered to be the main down-regulator of the PI3 kinase-Akt pathway.9 As AII reportedly triggers PTEN phosphorylation,10 our observations may suggest that increased myocardial AII content and enhanced PTEN phosphorylation levels observed in the OLETF-VEH group were involved in the mechanism for suppression of PI3 kinase-dependent Akt phosphorylation in response to HT. Essentially same responses to HT and candesartan treatment were observed in terms of Hsp72 expression, Akt phosphorylation, and PTEN phosphorylation in the hearts of rats fed a high-fat diet, another model of insulin resistance, and this may support our hypothesis. However, the mechanisms by which cardiac ventricular tissue AII levels increase in OLETF rats remain unclear. To the best of our knowledge, augmented tissue AII contents in OLETF rats have been reported in the kidney.20 Inconsistent with our observations, Nishiyama et al.20 demonstrated that the AII content in the kidney was higher in OLETF rats than in LETO rats, and that treatment with telmisartan prevented the augmentation of kidney AII levels in OLETF rats. However, the authors mentioned that they could not address the issues related to the mechanisms. In addition, the role of augmented ventricular tissue AII in the altered myocardial responses to HT observed in the present study remains unclear.
It has been reported that Jak2, a kinase upstream of PI3 kinase/Akt signalling, was phosphorylated by erythropoietin, and this response was reportedly depressed in OLETF rat hearts.21 Accordingly, we have investigated Jak2 phosphorylation in the present study. Hyperthermia induced Jak2 phosphorylation in LETO and OLETF rat hearts (P < 0.01); however, there was no apparent difference in Jak2 phosphorylation levels between the two groups, and candesartan did not influence the phosphorylation levels (data not shown).
Alternatively, the effects of candesartan may be explained by the improvement of systemic and/or cardiac metabolism, including insulin sensitivity. As shown in Figure 1B and C, during the OGTT, the response of plasma concentrations of glucose and insulin was typical of that observed in insulin-resistant animals.22 Thus, the 16-week-old OLETF rats can be regarded as an insulin-resistant model, but not a type 2 diabetes model. By using OLETF rats of the same age, we have recently demonstrated that a 4 week treatment regimen with pioglitazone, but not glibenclamide, restored PI3 kinase-dependent Akt phosphorylation and Hsp72 expression in response to HT.5 As evaluated by an OGTT, while those two drugs suppressed the increase of plasma glucose concentration comparably, pioglitazone, but not glibenclamide, suppressed the increase of plasma insulin concentration in OLETF rats.5 Therefore, we attributed the restoration of Hsp72 by pioglitazone to an improvement in insulin sensitivity.5 In the present study, systemic improvement of insulin sensitivity was not obtained with candesartan. Furthermore, an estimation of GLUT4 translocation to the membrane in response to insulin injection demonstrated no change following the treatment with candesartan. These observations suggest that changes in insulin sensitivity might not be involved in the restored Hsp72 expression by candesartan. In this regard, many investigators have demonstrated an improvement of insulin sensitivity by antagonism of the renin–angiotensin system.6–8 However, inconsistent with our observations, Uehara et al.23 reported that AT1 receptor antagonists improve haemodynamic and renal changes without affecting glucose metabolism in OLETF rats. Our relatively short-term treatment (2 weeks) with candesartan might not be long enough to improve insulin sensitivity.
Herein, we have discussed PI3 kinase-dependent Akt phosphorylation as a predominant signal for HT-induced Hsp72 expression. However, the cascade may not be the sole pathway. As shown in Figure 2C and D, HT-induced Akt phosphorylation was more depressed in OLETF rats than in LETO rats, both of which were reduced to comparable levels by pre-treatment with wortmannin. As the restoration of HT-induced Akt phosphorylation by candesartan was parallel to the restoration of Hsp72 expression in OLETF rat hearts, candesartan appears to improve HT-induced Hsp72 expression via PI3 kinase-dependent Akt phosphorylation. However, when assessed before treatment with candesartan, while Hsp72 expression was suppressed by the pre-treatment with wortmannin in LETO rat hearts, it was not suppressed by wortmannin in OLETF rat hearts (Figure 2A and B). This finding suggests that mechanisms other than PI3 kinase-dependent Akt phosphorylation play a role in the induction of Hsp72 expression by HT. Candesartan might modify the unknown cascade to improve Hsp72 expression.
There is important clinical relevance in our observations. Both OLETF rat hearts and hearts from rats fed a high-fat diet showed a depressed myocardial response to HT to induce cardioprotective Hsp72 expression. More importantly, this alteration was improved by the treatment with candesartan. As there have been no reports that demonstrated clinical benefits of candesartan in diabetic cardiomyopathy, future clinical investigations are required.
In conclusion, our results suggest that depression of PI3 kinase-dependent Akt activation, an essential signal for Hsp72 expression, can be restored in OLETF rats by candesartan. Substantial activation of the renin–angiotensin system, represented by increased myocardial AII content and enhanced PTEN phosphorylation, may underlie the pathogenesis which is ameliorated by candesartan.
Conflict of interest: none declared.
Funding
This study was supported in part by a Grant-in-Aid 17590756 (to T.S.) from the Japanese Ministry of Education, Science, and Culture, and grants from the Ministry of Health, Labour, and Welfare (034).


