-
PDF
- Split View
-
Views
-
Cite
Cite
Shiho T. Morita, Douglas P. Zipes, Hiroshi Morita, Jiashin Wu, Analysis of action potentials in the canine ventricular septum: No phenotypic expression of M cells, Cardiovascular Research, Volume 74, Issue 1, April 2007, Pages 96–103, https://doi.org/10.1016/j.cardiores.2007.01.003
Close - Share Icon Share
Abstract
Objective: Transmural heterogeneity in the ventricular free wall, enhanced by the midmyocardial long action potential duration (APD) of M cells, plays an important role in the arrhythmogenesis of long QT syndrome. Although we observed dynamic expression of M cell phenotypes in the canine ventricular free wall, it is still unclear whether similar phenomena are present in the interventricular septum. This study evaluated transmural heterogeneity of APD in the septum.
Methods: We isolated and perfused 22 canine septal preparations through the septal branch of the anterior descending coronary artery, and optically mapped 256 channels of action potentials on their cut-exposed transseptal surfaces before and after treatment with sotalol (IKr blocker), anemone toxin II (ATX-II, which slows the inactivation of INa), or drug-free state in 6, 9, and 22 preparations, respectively. The preparations were paced from the left ventricular endocardium at cycle lengths of 500, 1000, 2000, and 4000 ms.
Results: We observed progressively lengthening of APD across the septum from the right ventricular to the left ventricular endocardium without a midmyocardial maximum under all conditions. All action potentials had minor phase-1 notches, resembling the endocardial action potential in the ventricular free wall. Increasing cycle lengths and concentrations of sotalol and ATX-II prolonged APD without midmyocardial preference and increased the transseptal dispersion of APDs.
Conclusions: Canine interventricular septal action potentials are similar in shape to the endocardial action potentials in the ventricular free wall, with smooth transseptal transition in APD. We found no phenotypical expression of M cells in the canine interventricular septum.
1. Introduction
Transmural heterogeneity of action potential duration (APD) and repolarization in the ventricular free wall plays an important role in arrhythmogenesis. Under physiological conditions, ventricular APDs are shortest in the epicardium and longest in the subendocardium. However, the longest APDs can appear in the midmyocardium under pathological, pharmacological, or experimental conditions, especially in ventricles having long QT syndrome (LQTS) or reduced repolarization reserve [1,2]. The midmyocardial phenotypical expression of significantly longer APDs than in the endocardium and epicardium is commonly referred to as M cells [3–7], which were observed in the deep subendocardium to midmyocardium in the anterior wall, and in the deep subepicardium to midmyocardium in the lateral wall of canine left ventricle and in the right ventricular outflow tracts [5]. Manifestation of M cells has been suggested to play a major role in the formation of T and U waves in electrocardiogram (ECG) [8,9] and in ventricular arrhythmogenesis [4–6]. Excessive prolongation of M cell APD can trigger ventricular arrhythmias by causing spontaneous early afterdepolarizations, create functional conduction block that facilitates reentry, and increase the dispersion of repolarization. Compared to epicardial and endocardial myocytes, ventricular myocytes expressing M cell phenotypes have lower membrane density of the slowly activating component of the delayed rectifier current (IKs) [6], which causes significant APD prolongation when combined with the reduction of other repolarization currents [e.g., the rapid activating component of the delayed rectifier current, IKr, in type 2 LQTS, (LQT2)] or with the enhancement of inward currents [e.g., the late Na+ current, INa, in type 3 LQTS, (LQT3)]. Although the above studies identified M cells in the ventricular free wall, evidence of M cells was not found in several other investigations in human [10–14] and in dog ventricle without pharmacological QT prolongation [15–17]. We have recently attempted to reconcile these conflicting previous reports by demonstrating that M cell phenotypes were manifested functionally and conditionally in the canine left ventricular free wall [16].
Although the left ventricular free wall has been studied extensively, and the molecular and action potential (AP) differences between the left and right endocardium of interventricular septum (IVS) have been reported [18], the presence of M cell phenotypes and the functional dynamics of AP and its transseptal profile in the IVS are still unclear. We carried out this study to investigate the transseptal profile, heterogeneity, and functional dynamics of APs and to determine the presence of phenotypical expression of M cells in isolated and arterially perfused canine IVS preparations. The presence of intact intercellular coupling is a major advantage of the IVS preparation over isolated cells in studying the mechanisms of arrhythmia.
2 Methods
2.1 Surgical preparation
The investigation confirms to the Guide for the Care and Use of Laboratory Animals published by the National Institutes of Health (NIH publication No. 85-23, revised 1996). We harvested hearts from 22 adult mongrel dogs (25–30 kg), after intravenous injections of heparin sodium (5000 units) and pentobarbital sodium (30 mg/kg body weight), and quickly Langendorff-perfused the hearts with an ice-cold hyperkalemia cardioplegic solution (Tyrode's solution as shown below with 15 mmol/l KCl). The cardioplegic perfusion washed out the blood and pentobarbital sodium and protected the hearts during the subsequent period of tissue isolation.
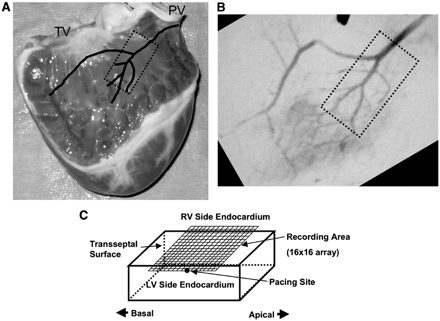
We cannulated and perfused the septal branch of the left anterior descending coronary artery then performed angiography using an iodine containing contrast media to identify the branches of the arterial tree and regions of perfusion (Fig. 1). We isolated a well perfused transseptal section of IVS (30–40 mm long by 8–10 mm wide on the endocardium and 15–18 mm across the septum) containing the cannulated septal artery (diameter: ≥1 mm) along its length, about 15–30 mm from the tricuspid valve, washed out the contrast media with sufficient perfusion, inserted a second cannula into the proximal opening of the septal branch for monitoring perfusion pressure, and trimmed off underperfused tissue. Major arterial leaks in the tissues were ligated with silk sutures. The isolated preparations were mounted in a temperature-controlled (37±0.5 °C) tissue chamber, perfused with 37±0.5 °C Tyrode's solution (in mmol/l: 128.0 NaCl, 4.0 KCl, 22.0 NaHCO3, 0.65 NaH2PO4, 0.50 MgCl2, 11.1 dextrose, and 2.0 CaCl2, and gassed with 95% O2–5% CO2) at an arterial pressure of 40–50 mm Hg, and immersed in the perfusion efflux.
The location of transseptal tissue preparations in canine interventricular septum (IVS). Tissues (without papillary muscle) were isolated (dotted rectangular area in Panels A and B) after the branches of the septal artery were located angiographically. Panel C illustrates the recording area on the cut-exposed transeptal surface of an isolated IVS preparation. TV: tricuspid valve. PV: pulmonary valve. LV and RV: left and right ventricles.
2.2 Transseptal mapping of action potentials
Each tissue was stained with di-4-ANEPPS (4-[beta-[2-(di-n-butylamino)-6-naphthyl]vinyl]pyridinium, ∼4 μmol/l in perfusate, Biotium, Hayward, CA), a membrane potential sensitive fluorescent dye used widely in optical mapping studies, after >100 min of tissue recovery and equilibration during continued Tyrode's perfusion. We evaluated the health of the tissues according to our published criteria [15,19] and immobilized the verified tissues with cytochalasin D (20–30 μmol/l, Fermentek, Jerusalem, Israel). Cytochalasin D immobilizes tissue by high affinity biding to actin, and also by reducing the Ca2+ sensitivity of myofilaments in cardiac myocytes [20]. We verified previously that canine ventricular APs were not affected by cytochalasin D at concentrations up to 80 μmol/l using microelectrodes in isolated ventricular trabeculae [21] and up to 40 μmol/l using optical mapping in isolated ventricular wedges [15]. In addition to canine ventricular myocardium, cytochalasin D also had no visible effects on rat ventricular AP [22], although it can affect mouse APs [23] due to significant interspecies differences in the repolarization currents [24].
The tissues were paced (2 ms duration, 2× diastolic current threshold, bipolar electrode) from the left ventricular (LV) endocardium. Two silver electrodes were placed in the chamber, one at the LV side (negative) and the other at the right ventricular (RV) side (positive) of the preparation, to record the transseptal electrogram. An optical mapping system [15] with a 256-element (16×16) photodiode camera (C4675, Hamamatsu, Japan) and a long-pass (>610 nm) optical filter collected the fluorescence (excited by 540±10 nm light) from an area of 19.5×19.5 mm2 on the cut-exposed transseptal surface of the tissue and converted it into 256 channels of electrical signals. Each channel of electrical signal corresponded to a surface area of 1.1×1.1 mm2. A custom data acquisition system recorded the steady-state baseline APs and transseptal electrogram after more than 20 pacing beats at each of the sequentially increasing pacing cycle lengths (CLs) of 500, 1000, 2000, and 4000 ms (baseline recordings) after the preparations fully recovered, stabilized, and were verified and immobilized, similar to our previous experiments [2,15,16,19,25,26].
2.3 Canine transseptal tissue models of LQT2 and LQT3
After the completion of baseline recordings, we created the drug-induced model of LQT2 with an IKr blocker, (+/−)-sotalol (Sigma Chemical, St. Louis, MO) [27] at sequentially increasing concentrations of 0, 12.5, 25, 50, and 100 μmol/l in 6 septal preparations, and the drug-induced model of LQT3 with an agent that slows inactivation of INa, anemone toxin II (ATX-II, Calbiochem-Novabiochem, San Diego, CA) [16,27,28] at sequentially increasing concentrations of 0, 1.25, 2.5, 5.0, and 10.0 nmol/l in 9 preparations. Electrophysiological recordings done at baseline were repeated after >20 min of perfusion stabilization at each of the above concentrations of sotalol or ATX-II.
2.4 Data processing and statistical analysis
All raw data were processed and analyzed using custom software developed for the optical mapping system. Conduction time (CT) was measured from the interval between the pacing spike and the maximum rate of depolarization. The time of depolarization was determined at the maximum rate of upstroke of AP. The time of repolarization was determined at the peak of the second-order derivative of AP. All depolarization and repolarization measurements were visually inspected and manually corrected when necessary, as we reported previously [15,16,19]. APD was derived from the interval between depolarization and repolarization. Distributions (maps) of CTs and APDs were measured at all recording sites on the cut-exposed transseptal surface. All measurements were from the data recorded during paced activation without interference from ectopic beats.
Statistical analysis was performed with Student's t test for paired data or analysis of variance (ANOVA) coupled with Scheffe's test, as appropriate. APDs were statistically analyzed at the same recording row sites. Differences were considered significant if p<0.05.
3 Results
3.1 Baseline transseptal distribution of APDs
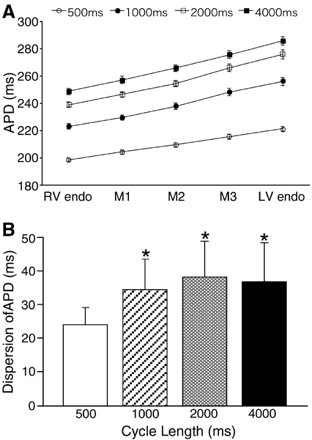
At baseline (Figs. 2A, C, and 3), APDs were CL-dependent, and were always significantly longer in the LV endocardium (longest) than in the RV endocardium (shortest) with transseptal monotonic and progressive transition without midmyocardial maxima at all tested pacing CLs. Increasing the pacing CL from 500 to 4000 ms prolonged APDs significantly, more in the LV endocardium (from 221.4±7.7 to 285.7±15.5 ms, n=22) than in the RV endocardium (from 198.6±6.6 to 248.7±11.5 ms, n=22), thus increasing the transseptal dispersion of APD (from 22.8±5.6 to 37±12.7 ms, n=22) (Fig. 3), which had clear CL-dependency at CL of 2000 ms or less (Fig. 3B). All APs in the IVS had minor phase-1 notch, similar to the endocardial APs in the ventricular free wall. The minor phase-1 notch is most likely a general feature of APs in the IVS, because we previously showed prominent phase-1 notches in the epicardium of similarly prepared canine ventricular free wall wedges under similar conditions using the same mapping system [15,16,2,25]. There was no evidence of M cell-like behavior in any IVS preparation during baseline recordings at CLs 500 to 4000 ms, although APs in the LV endocardium were always longer than in the RV endocardium.
Effects of bradycardia on APDs in 22 IVS preparations. APDs were measured from all recording sites in the parallel rows at the RV endo, 25%, 50%, 75% across the IVS from the RV endo (M1, M2, and M3), and at the LV endo. A: Increasing pacing cycle length (CL) prolonged APDs at all transseptal layers without midmyocardial maxima. Error bars represent SEM. B: Increasing CL expanded the transseptal (LV endo-RV endo) dispersion of APD. *Indicates significant (p<0.01) expansion of the transseptal dispersion of APD compared to the corresponding dispersions at CL of 500 ms. Error bars represent SD.
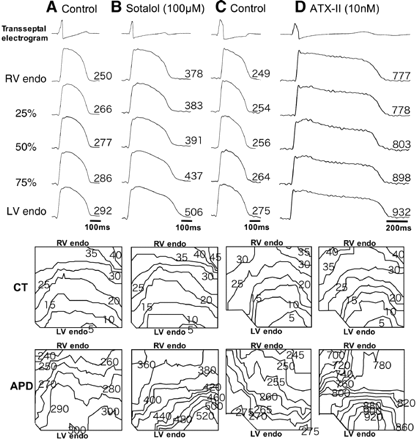
Transseptal electrogram, action potential (AP) recordings, isochronal maps of conduction time (CT), and isochronal maps of action potential duration (APD) in the absence (A and C) and presence of sotalol (100 μmol/l, B) and ATX-II (10 nmol/l, D) at pacing cycle length (CL) of 4000 ms. The action potentials were from five transseptal sites: RV side of the endocardium (RV endo), 25%, 50%, 75% across the IVS from the RV endo, and LV side of the endocardium (LV endo). A and B were from a single tissue. C and D were from another tissue. The longest APDs were always at the LV septal endocardium.
3.2 APDs in the drug-induced models of LQT2 and LQT3
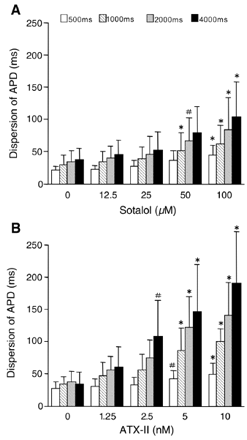
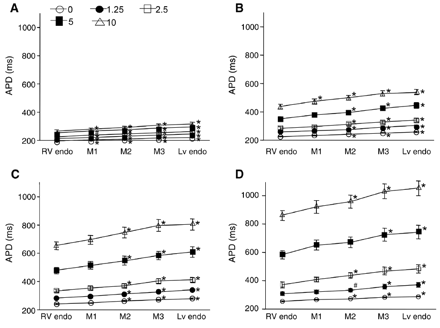
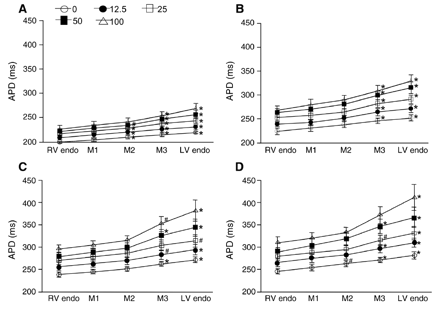
We investigated the functional dynamics of transseptal distribution of APD in the IVS preparations treated with sotalol [27] or ATX-II [16,27,28], which produced drug-induced models of LQT2 and LQT3 and were demonstrated to promote the expression of M cells in the canine ventricular free wall [29]. Table 1 summarizes the electrographical findings in the perfused IVS preparations. These data demonstrate that sotalol 100 μmol/l prolonged only the repolarization time, and ATX-II 10 nmol/l prolonged both the duration and repolarization time of the transseptal electrogram. Conduction time patterns were almost the same before and after drugs with little conduction delay produced by drugs. Sotalol and ATX-II prolonged APDs in the IVS (Figs. 4 and 5), with greater prolongation in the LV septal endocardium than in the RV septal endocardium. Increasing the pacing CL also prolonged the APD, more in the LV septal endocardium than in the RV septal endocardium at each concentration of sotalol or ATX-II. Higher concentrations of sotalol and of ATX-II and longer pacing CLs increased the transseptal dispersion of APD (Fig. 6). At the highest sotalol concentration of 100 μmol/l and at a CL of 4000 ms, the LV and RV septal endocardial APDs increased to 1.45±0.04 (n=6) and to 1.26±0.02 (n=6) times their corresponding baseline control values, respectively, without significant differences (p=0.07) between the relative prolongations in the LV and RV septal endocardium. ATX-II at 10 nmol/l prolonged APD in the LV septal endocardium 3.65±0.32 (n=9) times and in the RV septal endocardium 3.39±0.33 (n=9) times the corresponding baseline control values (CL: 4000 ms), but the difference between the relative prolongations in the LV and RV septal endocardium was not significant (p=0.36).
Dependencies of the transseptal dispersion of APD on pacing CL, sotalol (n=6, A), and ATX-II (n=9, B). Transseptal dispersion of APDs was calculated from the APD differences between the LV endo (the longest) and RV endo (the shortest) in the same tissue. The transseptal dispersions of APD were expanded by increasing concentrations of sotalol (A) and ATX-II (B) and by longer CLs (indicated at the top of A). Statistically significant increase in the transseptal dispersion of APD from the corresponding drug-free controls are indicated with * (p<0.01) and # (p<0.05). Error bars represent SD.
Effect of ATX-II on APDs. Tissues were paced at the LV endo at the CL of 500 (A), 1000 (B), 2000 (C), and 4000 ms (D). The symbols at the top of A indicate the concentrations of ATX-II (nmol/l). Similar to the effects of sotalol in Fig. 4, APDs progressively lengthened from the RV endo (shortest) to LV endo (longest) without excessive midmyocardial (M1–3) APDs lengthening. Significantly more APD prolongation than at the RV endo are indicated with * (p<0.01) and # (p<0.05). Error bars represent SEM (n=9).
Effects of sotalol on APD. Tissues were paced at the LV endo at CLs of 500 (A), 1000 (B), 2000 (C), and 4000 ms (D). The symbols at the top of A indicate the concentrations of sotalol (μmol/l). APDs lengthened progressively from the RV endo (shortest) to LV endo (longest) without midmyocardial (M1, M2, and M3 for 25%, 50%, and 75% transseptum from RV endo) preferential lengthening. Significantly more APD prolongation than at the RV endo are indicated with * (p<0.01) and # (p<0.05). Error bars represent SEM (n=6).
Effects of sotalol and ATX-II on the duration and repolarization time of the transseptal electrogram in the perfused interventricular septal preparations
| . | Duration of the transseptal electrogram (ms) . | Repolarization time of the transseptal electrogram (ms) . | ||
|---|---|---|---|---|
| CL=4000 ms . | CL=500 ms . | CL=4000 ms . | CL=500 ms . | |
| Control (n=15) | 72.9±5.2 | 73.9±5.8 | 309.2±10.6 | 258.7±10.7 |
| Sotalol 100 μmol/l (n=6) | 73±4.1 | 74.5±3.8 | 419±71.2* | 289.2 ± 16.8* |
| ATX-II 10 nmol/l (n=9) | 83.4±5.9* | 85.3±5* | 1083.7±160.5* | 317.9±24.1* |
The duration and repolarization time of the transseptal electrogram were measured in similar ways as the QRS and QT in ECG. CL: cycle length. Data are expressed as mean±SD ms and n is the number of preparations. *p<0.01 sotalol or ATX-II vs control.
Similar to the baseline recordings, there was no midmyocardial maxima of APD in all preparations treated with sotalol or ATX-II, even at the highest tested concentrations of sotalol (100 μmol/l) and ATX-II (10.0 nmol/l) and at the longest pacing CL (4000 ms). APDs prolonged with increasing CL from 500 to 4000 ms and lengthened progressively from the shortest APDs at the RV septal endocardium (sotalol: 309±36.2 ms, n=6; ATX-II: 857.2±121.6 ms, n=9, CL=4000 ms) to the longest APDs at the LV septal endocardium (sotalol: 411.2±71.5 ms; ATX-II: 1046.4±176 ms) with significant APD differences between the RV and LV septal endocardium (p<0.0001). Therefore, there was no evidence of M cell phenotypes in the IVS drug-induced models of LQT2 and LQT3.
4 Discussion
4.1 New observations
We observed on the cut-exposed transseptal surface that all APs lacked a prominent phase-1 notch with APD lengthening progressively from the right to left ventricular endocardium across the IVS without a midmyocardial maximum under all tested conditions. This occurred during bradycardia, sotalol, and ATX-II, which prolonged APD and increased its transseptal dispersion and were demonstrated previously to promote phenotypical expression of M cells in canine ventricular free wall [4,5,6,7,16,27], in contrast to the absence of M cell expression in IVS in the current study. We conclude that, in this investigation, the studied region of IVS had electrophysiological characteristics similar to the endocardium of ventricular free wall with gradual transseptal AP transition and without phenotypic expression of M cells.
The current observations differed from a prior study that reported the presence of M cells in deep subendocardial layers of superfused strips of canine IVS tissue [6]. The different observations might be related to the differences between arterial perfusion (in the current study) and superfusion (in the prior study).
4.2 Possible mechanisms
The present observations correspond well with a molecular study on the differences between LV and RV septal endocardium in the relevant mRNAs encoding major ionic channels in canine IVS. Ramakers et al. [18] found that the levels of KChIP2, NCX, and KCNQ1, which are mRNAs encoding the β subunit of Ito channel, Na–Ca exchanger, and α subunit of IKs channel, respectively, were significantly higher in the right half than in the left half of IVS. They also observed similar APs and similar levels of KChlP2 and KCNQ1 between the right septal endocardium and the endocardium of right ventricular free wall, and between the left septal endocardium and the endocardium of left ventricular free wall.
The present observations are also in agreement with a previous report showing that isolated mid-septal myocytes had APDs midway between those recorded in the isolated LV septal endocardial myocytes (longest APDs) and RV septal endocardial myocytes (shortest APDs) in the basal sections of guinea-pig IVS [30]. Both the above mRNA [18] and isolated myocytes [30] studies suggested the absence of M cell phenotypes were the cellular property of the septum, rather than being caused by electrotonic suppression from intercellular coupling, which reduces electrical heterogeneity in cardiac tissue. The current optical mapping and above molecular and isolated cell studies correspond well with the embryonic development of the IVS, formed by expansion of both RV and LV endocardium [31] and support the notion that canine RV and LV septal endocardium have electrophysiological properties similar to the respective endocardium of right and left ventricular free walls.
4.3 Differences between IVS and ventricular free wall
We reported previously the presence of M cell phenotypes during ATX-II perfusion and long pacing CL and observed prominent phase-1 notches in the epicardial APs in canine ventricular free wall [2,16,25]. However, in the current study we found no phenotypic expression of M cells and minor phase-1 notches in all AP in the canine IVS, although similar experimental protocols and the same instrument and drugs were used. Therefore, the differences in the manifestation of M cell phenotypes and in the morphology of AP were due to the substrate differences between IVS and ventricular free wall, which can be related to their differences in embryonic development [31]. The observation of M cell phenotypes in the left ventricular free wall indicated that presence of intact intercellular coupling was not the cause of absence of M cell phenotypes in the septum preparations.
The absence of M cell phenotypes in the IVS suggests that, unlike the ventricular free wall, the septum has no midmyocardial region having low repolarization reserve [1,2]. Our results also suggest that one of the mechanisms of arrhythmogenesis, focal activation by early afterdepolarizations arising from the phase-2 domes of APs in the M cell regions, as demonstrated in ventricular free walls having LQTS [2,25], may play a less important role in the IVS. Instead, the IVS may contribute to arrhythmogenesis by providing pathways for reentry loops [32] and by other mechanisms of focal activation such as delayed afterdepolarizations.
4.4 IKr and INa alterations in the canine septal preparations
Transmural heterogeneity in membrane densities of repolarization currents has been reported in the canine ventricular free wall [5], although it is still unclear whether similar heterogeneity exists in the IVS. We manipulated IKr and INa with sotalol and ATX-II, two drugs demonstrated previously to promote the expression of M cell phenotypes in canine ventricular free wall [31,33–37]. We observed that both drugs prolonged APD without evoking phenotypical expression of M cells and increased the transseptal dispersion of APD in IVS. At similar APD prolongation, sotalol increased the transseptal dispersion of APD more than ATX-II (Figs. 4D and 5D). The differences suggested that IKr blockade with sotalol exposed more transseptal heterogeneity in the remaining repolarization currents than enhancing the late INa with ATX-II.
Acknowledgements
This research was supported by award 0455517Z from American Heart Association Midwest Affiliation and by the Herman C. Krannert Fund, Indianapolis.
References
Author notes
Time primary review 27 days


