-
PDF
- Split View
-
Views
-
Cite
Cite
Andreas Skyschally, Rainer Schulz, Petra Gres, Ina Konietzka, Claus Martin, Michael Haude, Raimund Erbel, Gerd Heusch, Coronary microembolization does not induce acute preconditioning against infarction in pigs—the role of adenosine, Cardiovascular Research, Volume 63, Issue 2, August 2004, Pages 313–322, https://doi.org/10.1016/j.cardiores.2004.04.003
Close - Share Icon Share
Abstract
Objective: After coronary microembolization (ME) adenosine is released from ischemic areas of the microembolized myocardium. This adenosine dilates vessels in adjacent nonembolized myocardium and increases coronary blood flow. For ischemic preconditioning (IP) to protect the myocardium against infarction, an increase in the interstitial adenosine concentration (iADO) prior to the subsequent ischemia/reperfusion is necessary. We hypothesized that the adenosine release after ME is sufficient to increase iADO and protect the myocardium against infarction from subsequent ischemia/reperfusion. We have therefore compared myocardial protection by either coronary microembolization or ischemic preconditioning prior to ischemia/reperfusion. Methods: In anesthetized pigs, the left anterior descending (LAD) was cannulated and perfused from an extracorporeal circuit. In 11 pigs, sustained ischemia was induced by 85% inflow reduction for 90 min (controls). Two other groups of pigs were subjected either to IP (n=8; 10-min ischemia/15-min reperfusion) or coronary ME (n=9; i.c. microspheres; 42 μm Ø; 3000·ml−1·min inflow) prior to sustained ischemia. Coronary venous adenosine concentration (vADO) and iADO (microdialysis) were measured. Infarct size was determined after 2-h reperfusion by triphenyl tetrazolium chloride staining. Results: In pigs subjected to IP, infarct size was reduced to 2.6±1.1% (mean±S.E.M.) vs. 17.0±3.2% in controls. iADO was increased from 2.4±1.3 to 13.1±5.8 μmol·l−1 during the reperfusion following IP. In pigs subjected to ME, at 10 min after ME, coronary blood flow (38.6±3.6 to 53.6±4.3 ml·min−1) and vADO (0.25±0.04 to 0.48±0.07 μmol·l−1) were increased. However, iADO (2.0±0.5 at baseline vs. 2.3±0.6 μmol·l−1 at 10 min after ME) did not increase. Infarct size induced by sustained ischemia following ME (22.5±5.2%) was above that of controls for any given subendocardial blood flow. Conclusion: ME released adenosine into the vasculature and increased coronary blood flow. The failure of iADO to increase with ME possibly explains the lack of protection against infarction after ME.
1. Introduction
Atherosclerotic plaque rupture, occurring either spontaneously or during coronary interventions, results in the release of atheromatous and/or thrombotic material into the coronary circulation which may then embolize the microvascular bed. Such coronary microembolization (ME) was identified as a potential cause of arrhythmias, contractile dysfunction and infarctlets [1].
In anesthetized dogs, coronary microembolization with polystyrene microspheres of 42-μm diameter induces an immediate ischemic contractile dysfunction which recovers over several minutes. Subsequently, myocardial function is progressively reduced whereas coronary blood flow remains unchanged or is even increased (perfusion–contraction mismatch) [2,3]. The increase in coronary blood flow is attributed to vasodilation of adjacent nonembolized vessels in response to adenosine release from the ischemic microembolized myocardium [4,5]. The progressive myocardial contractile dysfunction in the presence of normal or increased blood flow following microembolization is associated with an inflammatory response, characterized by increased leukocyte infiltration and increased tumor necrosis factor-α (TNFα) concentration within the myocardium [2]. TNFα is causally involved in the progressive contractile dysfunction, since intracoronary infusion of TNFα mimicked contractile dysfunction in the absence of microembolization and contractile dysfunction following microembolization was prevented by pretreatment with TNFα-antibodies [6]. The inflammatory signal cascade also involves nitric oxide upstream of TNFα and sphingosine downstream of TNFα [7].
After coronary microembolization, adenosine is released from small ischemic areas in the microembolized myocardium. This adenosine dilates vessels in the adjacent non-embolized myocardium and increases myocardial blood flow [4,5]. Adenosine is an important trigger of ischemic preconditioning (IP) in many species including pigs [8] and also humans [9]. In the previous experiments from our laboratory, we have shown that in anesthetized pigs, one cycle of ischemic preconditioning by 10-min low-flow ischemia and 15-min reperfusion protects the myocardium from the consequences of subsequent 90-min low-flow ischemia and 120-min reperfusion and reduces infarct size [10]. An increase in the interstitial adenosine concentration (iADO) prior to the sustained ischemia is necessary to establish this protection against infarction [10,11].
To take advantage of our established model of ischemic preconditioning in pigs [10,11], we have now transferred our microembolization model from anesthetized dogs to anesthetized pigs, and we hypothesized that the adenosine release following an episode of coronary microembolization is sufficient to increase the interstitial adenosine concentration and to protect the surrounding myocardium against ischemia/reperfusion-induced infarction. We have therefore compared myocardial protection by either coronary microembolization or ischemic preconditioning prior to a 90-min low-flow ischemia followed by 120-min reperfusion. To assess myocardial protection infarct size resulting from 90-min ischemia/120-min reperfusion was determined, and the role of adenosine was evaluated by measuring arterial, coronary venous, and interstitial (microdialysis) adenosine concentrations.
In our experiments, coronary microembolization did not protect against infarction, possibly due to a lack of increase in interstitial adenosine prior to the sustained ischemia, which is seen with ischemic preconditioning.
2. Methods
The experimental protocols were approved by the Bioethical Committee of the district of Düsseldorf, and the investigation conforms with the Guide for the Care and Use of Laboratory Animals published by the US National Institutes of Health (NIH Publication No. 85-23, revised 1996).
2.1. Experimental preparation
Thirty-six Göttinger minipigs (20–40 kg) of either sex were used in our experiments. The pigs were fed ad libitum before the experiments. After initial sedation using ketamine hydrochloride (1 g intramuscularly), the pigs were anesthetized with thiopental (Trapanal, 500 mg intravenously). Through a midline cervical incision, the trachea was intubated for connection to a respirator (Dräger, Lübeck, Germany). Anesthesia was then maintained using enflurane (1–1.5%) with an oxygen/nitrous oxide mixture (40%:60%). Arterial blood gases were monitored frequently in the initial stages of the preparation until stable and then periodically throughout the study (Radiometer, Copenhagen, Denmark). Rectal temperature was monitored and maintained between 37 and 38 °C by the use of a heated surgical table and drapes. The common carotid arteries were cannulated with polyethylene catheters, one to measure arterial pressure and the other to supply blood to the extracorporeal circuit. The jugular veins were cannulated for volume replacement using warmed 0.9% NaCl and for the return of blood to the animal from the coronary venous line.
A left lateral thoracotomy was performed in the fourth intercostal space and the pericardium opened. A micromanometer (P7, Konigsberg Instr., Pasadena, CA, USA) was placed in the left ventricle through the apex together with a saline-filled polyethylene catheter (used to calibrate the micromanometer in situ). Ultrasonic dimension gauges were implanted in the left ventricular (LV) myocardium to measure the thickness of the anterior and posterior (control) wall. The left anterior descending (LAD) coronary artery was dissected over a distance of 1.5 cm, ligated, cannulated, and perfused from an extracorporeal circuit. Prior to coronary cannulation, the pigs were anticoagulated with 20,000 IU sodium heparin; additional doses of 10,000 IU were given at hourly intervals. The system included a roller pump, windkessel, and a side-port for the injection of microspheres. Coronary arterial pressure was measured from the sidearm of a polyethylene T-connector (Cole-Parmer, Chicago, IL, USA) used as catheter tip with an external transducer (pvb Medizintechnik, Kirchseon, Germany). Minimal coronary arterial pressure was held above 70 mm Hg by adjusting the roller pump of the extracorporeal circuit to avoid hypoperfusion prior to ischemia. The large epicardial vein parallel to the LAD coronary artery was dissected and cannulated. Coronary venous blood was drained to an unpressurized reservoir and then returned to a jugular vein through use of a second roller pump.
Heart rate was controlled throughout the study by left atrial pacing (Hugo Sachs Elektronik Type 215/T, Hugstetten, Germany) slightly above the spontaneous rate.
2.2. Regional myocardial blood flow
Radiolabeled microspheres (15 μm in diameter; 141Ce, 51Cr, 103Ru, 95Nb, or 46Sc; NEN-DuPont, Boston, USA) were injected into the coronary perfusion circuit to determine the regional myocardial blood flow and its distribution throughout the LAD perfusion bed (model 5912, Gammaszint BF 5300 Packard, Germany).
2.3. Morphology
At the end of each study, the heart was removed and sectioned from base to apex into five transverse slices in a plane parallel to the atrioventricular groove. The slices were immersed in 0.09 mol·l−1 sodium phosphate buffer (pH 7.4) containing 1.0% triphenyl tetrazolium chloride (Sigma-Aldrich Chemie, Munich, Germany) and 8% dextran (MW 77,800) for 20 min at 37 °C to identify infarcted tissue. The amount of infarcted tissue is expressed as percent of the LV area at risk, as determined by the microspheres technique [10].
2.4. Adenosine
Plasma adenosine concentrations were measured in simultaneously drawn coronary venous and arterial blood samples. Samples were taken at baseline in all groups, at 10 min of the reperfusion following ischemic preconditioning in group 2, and at 10 min after coronary microembolization in group 3. At 5 and 85 min of the sustained ischemia, samples were again taken in all groups. The blood samples were withdrawn with syringes containing ice-cold dipyridamole solution (0.2 mM, Dr. Karl Thomae, Biberach, Germany) and 0.1 mM α,β-methylene-adenosine-5-diphosphate-solution (Sigma, Taufkirchen, Germany) stopping the uptake and breakdown of adenosine by erythrocytes [12] and immediately centrifuged. The plasma was collected and stored at −70 °C.
The measurement of interstitial adenosine concentration was performed by a microdialysis technique. For in vivo sampling of dialysate aliquots, the microdialysis probes (CMA/220, Bioanalytical Systems, West Lafayette, USA) were inserted into the myocardium within the perfusion bed of the left anterior descending coronary artery, such that a 10-mm-long segment containing a dialysis membrane with a molecular cutoff of 20,000 D spanned the entire transmural wall. After insertion, the inflow tube of the probe was connected to a gas-tight plastic syringe filled with a modified Krebs-Henseleit buffer consisting of (in mM) 118 NaCl, 4.7 KCl, 1.2 MgSO4, 1.2 KH2PO4, 1.30 CaCl2, 25.0 NaHCO3, 5.0 glucose. The pH was adjusted to 7.4 with NaOH. The probe was perfused at 2.82 μl·min−1 with a modified syringe infusion pump (Perfusor ED2, Braun Melsungen, Melsungen, Germany), and the effluent was sampled into capped microcentrifuge tubes. Each probe was perfused for 30 min prior to the start of a protocol and these samples were discarded. Then, beginning 30 min before the first ischemic episode, the effluent was collected in 10-min fractions throughout the whole experiment and the samples were immediately frozen and stored in liquid nitrogen. The adenosine concentration in the collected dialysate samples was stable, even when stored at room temperature for several hours.
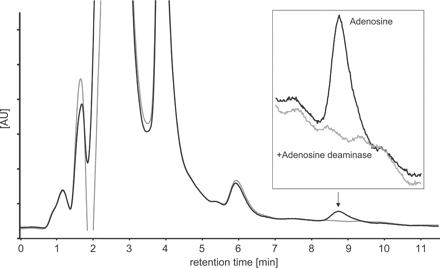
Adenosine concentrations in arterial and venous plasma and in the dialysate collected from the microdialysis probes were determined by HPLC as described previously [11]. A typical chromatogram of the HPLC separation is given in Fig. 1.
Representative chromatogram of adenosine separation by HPLC in a microdialysis sample. The arrow indicates the adenosine peak which is magnified in the inset. The adenosine peak was removed by adding adenosine deaminase (gray tracing) and no interfering peaks were detectable.
2.5. Experimental microembolization in anesthetized pigs
Our prior studies on coronary microembolization were done in dogs [2,3,7], whereas those on ischemic preconditioning were done in pigs [10,11]. We therefore performed four control experiments with coronary microembolization in pigs to assure the transfer of the model from dogs to pigs.
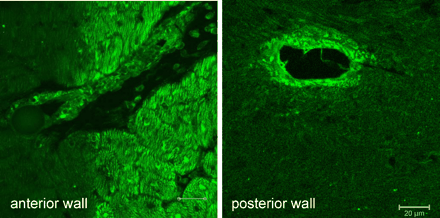
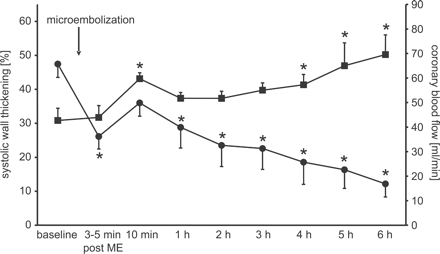
Coronary microembolization was induced by injecting 3000 white-colored polystyrene microspheres (diameter 42 μm, Dynospheres, Dyno Particles, Lillestrøm, Norway) per ml·min−1 coronary inflow into the perfusion system. During microembolization, coronary inflow was held constant. Thereafter, coronary perfusion pressure was maintained at baseline levels for 6 h. At the end of the experiment, biopsies from the anterior and posterior wall were taken and analyzed for tissue concentrations of TNFα [13] and sphingosine [7]. In transmural histological sections, the amount of microinfarction was determined [14] and TNFα was visualized by immunostaining [15]. The consequences of coronary microembolization in pigs were almost identical to those previously observed in dogs. Immediately upon coronary microembolization, function of the microembolized myocardium rapidly decreased. After an initial partial recovery, which occurred within minutes, function progressively decreased over the following 6 h (Fig. 2). Myocardial concentrations of TNFα (Table 1 and Fig. 3) and sphingosine (Table 1) were higher in the anterior than in the posterior wall at 6 h after coronary microembolization. Small necrotic foci were present in the anterior wall (4.5±2.4% in total), and the number of leukocytes infiltrating the anterior wall was greater than that in the posterior wall (Table 1). Coronary blood flow was increased at 10 min after the microembolization, returned back towards baseline values at 1 h, but was increased again after 4 h, probably due to hemodilution (Hb: 107±2 g·l−1 at baseline vs. 74±5 g·l−1 at 6 h) (Fig. 2). Sham pigs (n=4) after 6 h have similar increases in coronary blood flow (40.0±3.8 ml·min−1 at baseline and 62.0±9.3 ml·min−1 at 6 h) and hemodilution (Hb: 106±6 g·l−1 at baseline vs. 68±6 g·l−1 at 6 h), but unchanged wall thickening (46.5±3.4% at baseline vs. 40.6±4.3% at 6 h).
TNFα in myocardium and vasculature. Immunohistological staining of tissue slices from the anterior and the posterior wall. In the anterior wall, distinct areas of myocytes adjacent to an embolizing microsphere are stained positive for TNFα; in the posterior wall staining is confined to the vascular wall (scaling bar 20 μm).
Progressive myocardial dysfunction after coronary microembolization. The arrow indicates the injection of embolizing microspheres. Coronary blood flow was held constant during injection of the embolizing microspheres. Systolic wall thickening of the anterior wall ( ) following an initial rapid recovery progressively decreased following coronary microembolization. Coronary blood flow (
 ) increased after microembolization.
Myocardial concentrations of TNFα and sphingosine and number of infiltrating leukocytes 6 h after experimental microembolization
| . | Microembolized anterior wall . | Non-embolized posterior wall . |
|---|---|---|
| TNFα [pg·g−1 WW] | 124.6±26.6* | 65.8±12.6 |
| Sphingosine [pMol·g−1 WW] | 330±88* | 136±30 |
| Leukocytes [mm−2] | 112±3* | 78±3 |
| . | Microembolized anterior wall . | Non-embolized posterior wall . |
|---|---|---|
| TNFα [pg·g−1 WW] | 124.6±26.6* | 65.8±12.6 |
| Sphingosine [pMol·g−1 WW] | 330±88* | 136±30 |
| Leukocytes [mm−2] | 112±3* | 78±3 |
p<0.05 vs. posterior wall (double-sided paired t-test).
3. Experimental protocols
Group 1 (n=11): Following baseline measurements of systemic hemodynamics, regional myocardial function and blood flow, coronary inflow was reduced to achieve a 85–90% reduction in anterior myocardial systolic wall thickening. At 5- and 85-min ischemia, measurements were repeated. After 90-min ischemia, the myocardium was reperfused for 2 h before infarct size was determined by TTC staining.
Group 2 (n=8): Following baseline measurements of systemic hemodynamics, regional myocardial function and blood flow, the myocardium was subjected to one cycle of 10 min preconditioning ischemia, with a 85–90% reduction in regional myocardial function, followed by 15-min reperfusion. During reperfusion, coronary arterial pressure was maintained at the level measured prior to ischemia by continuously adapting coronary inflow with the roller pump. Following reperfusion, coronary inflow was again reduced to the same level as during the preconditioning ischemia. Thereafter, the protocol of group 2 was identical to that of group 1.
Group 3 (n=9): Following baseline measurements of systemic hemodynamics, coronary microembolization was induced by injecting 3000 white-colored polystyrene microspheres (diameter 42 μm) per ml·min−1 coronary inflow into the perfusion system. During reactive hyperemia, coronary perfusion pressure was maintained constant at baseline levels. Ten minutes after microembolization, coronary inflow was reduced to a similar extent as in group 1. Thereafter, the protocol of group 3 was identical to that of group 1.
3.1. Data analysis and statistics
Data are reported as mean values±S.E.M. Systemic hemodynamic data and the interstitial adenosine concentration were analyzed by two-way ANOVA, and subendocardial blood flow during ischemia, area at risk, and infarct size were analyzed by one-way ANOVA. Fisher's LSD tests were used for post-hoc comparisons when overall significant differences were detected. The time courses of coronary venous plasma adenosine concentration were compared to those of the arterial plasma adenosine concentration by two-way ANOVA. Linear regressions between subendocardial blood flow and infarct size were compared by analysis of covariance (ANCOVA). A p value less than 0.05 was taken to indicate a significant difference.
4. Results
With the onset of the preconditioning ischemia in group 2 and the sustained ischemia in all groups, regional myocardial function in the anterior wall was significantly reduced (Table 2).
Hemodynamic data
| . | . | HR [min−1] . | LVP [mm Hg] . | dP/dt [mm Hg·s−1] . | WTant [%] . | CBF [ml·min−1] . |
|---|---|---|---|---|---|---|
| Group 1 | Baseline | 101±2 | 93.8±1.5 | 1347±129 | 35.5±3.8 | 46.8±7.9 |
| I5 | 102±2 | 82.9±1.9* | 1017±57* | 0.3±1.0* | 5.4±0.3* | |
| I85 | 102±2 | 81.1±2.3* | 1069±98* | 1.1±1.1* | 5.3±0.3* | |
| Group 2 | Baseline | 98±4 | 94.0±4.5 | 1530±153 | 34.6±3.7 | 27.7±3.0 |
| IPRep | 99±5 | 89.4±4.3 | 1232±62 | 19.4±3.2* | 34.5±4.1 | |
| I5 | 99±4 | 80.7±4.1* | 1079±76* | 0.8±1.5* | 6.3±0.9* | |
| I85 | 102±5 | 85.0±4.8 | 1141±94* | 1.5±1.7* | 6.3±0.9* | |
| Group 3 | Baseline | 101±4 | 101.8±2.6 | 1404±83 | 31.7±3.8 | 38.6±3.6 |
| ME | 102±4 | 99.3±3.0 | 1311±60 | 28.1±3.8 | 53.6±4.3* | |
| I5 | 103±5 | 80.6±3.5* | 919±36* | 0.5±1.1* | 5.7±0.9* | |
| I85 | 109±4 | 82.5±2.8* | 994±49* | 0.0±0.6* | 5.7±0.9* |
I5, I85: 5- and 85-min ischemia; IPRep: 15-min reperfusion after the preconditioning ischemia; ME: 10 min after coronary microembolization.
HR: heart rate; LVP: peak left ventricular pressure; dPdt: maximum of the first derivative of left ventricular pressure; WTant: systolic wall thickening of the anterior wall; CBF: mean LAD coronary inflow.
p<0.05 vs. baseline.
Anterior systolic wall thickening was slightly decreased at 10 min after injection of the embolizing particles (31.7±3.8% vs. 28.1±3.8%, n.s.). Coronary blood flow at 10 min after microembolization was increased from 38.6±3.6 to 53.6±4.3 ml·min−1 (p<0.05) with a peak flow of 59.5±4.3 ml·min−1 at 3.2±0.4 min after microembolization.
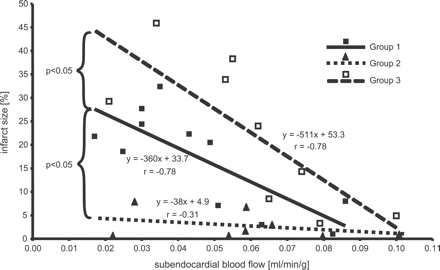
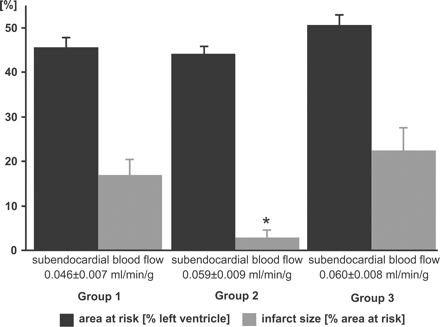
The area at risk was comparable between the groups (Fig. 4). In group 1 following 90-min severe myocardial ischemia and 120-min reperfusion, infarct size averaged 17.0±3.2%. Ischemic preconditioning by 10-min ischemia and 15-min reperfusion reduced infarct size following 90-min ischemia and 120-min reperfusion to 2.6±1.1% (p<0.05 vs. groups 1 and 3) and the relationship between infarct size and subendocardial blood flow was shifted downwards, with a smaller infarct size at a given subendocardial blood flow (p<0.05 ANCOVA; Fig. 5).
Linear regression between subendocardial blood flow and infarct size. With microembolization, the regression line was shifted upwards towards higher infarct size at a given subendocardial blood flow. With ischemic preconditioning, infarct size at a given subendocardial blood flow was reduced.
Area at risk, infarct size, and regional subendocardial blood flow. There were no significant differences between the three groups in subendocardial blood flow and area at risk. Infarct size was reduced by ischemic preconditioning in group 2. (Group 1: 90-min ischemia/2-h reperfusion; Group 2: 10-min ischemia/15-min reperfusion followed by 90-min ischemia/2-h reperfusion; Group 3: Coronary microembolization followed by 90-min ischemia/2-h reperfusion).
With microembolization in group 3, infarct size following 90-min ischemia and 120-min reperfusion was 22.5±5.2%. Compared to 90-min sustained ischemia alone, the relationship between infarct size and subendocardial blood flow was shifted upwards towards higher infarct size at a given subendocardial blood flow (p<0.05 ANCOVA; Fig. 5).
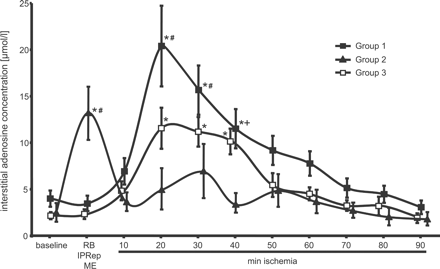
In group 1, the interstitial adenosine concentration increased with the onset of the sustained ischemia from 4.0±0.9 μmol·l−1 to a maximum of 20.4±4.3 μmol·l−1 at 20 min (Fig. 6).
Interstitial adenosine concentration. In group 1, the interstitial adenosine concentration increased after the onset of the sustained ischemia. In group 2, the interstitial adenosine increased six-fold during reperfusion (IPRep) following ischemic preconditioning. In group 3, the interstitial adenosine concentration remained unchanged with coronary microembolization (ME), but increased after the onset of the sustained ischemia. With ischemic preconditioning and coronary microembolization, the maximal increases in the interstitial adenosine concentration during the sustained ischemia were attenuated. (RB: repeated baseline measurement in group 1; IPRep: 10 min of reperfusion following ischemic preconditioning in group 2; ME: 10 min after coronary microembolization in group 3; *p<0.05 vs. Baseline; #p<0.05 Group 1 vs. Group 2 and 3; +p<0.05 Group 1 vs. Group 2).
In group 2, the interstitial adenosine concentration increased from 2.4±1.3 μmol·l−1 at baseline to 13.1±5.8 μmol·l−1 during reperfusion following the preconditioning ischemia. After a transient drop, the interstitial adenosine concentration increased again during sustained ischemia (peak 6.8±3.0 μmol·l−1 at 30 min, n.s.) but remained lower than in group 1.
In group 3 at 10 min after coronary microembolization, the interstitial adenosine concentration was not different from baseline values (2.0±0.5 μmol·l−1 at baseline vs. 2.3±0.6 μmol·l−1 at 10 min after microembolization), but it was increased with the onset of the sustained ischemia. The maximal increase during the sustained ischemia (11.6±2.2 μmol·l−1 at 20 min) was less than in group 1.
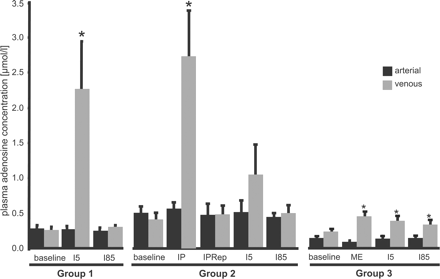
The coronary venous adenosine concentration was increased at 5 min after the onset of the sustained ischemia in group 1. In group 2, coronary venous adenosine concentration was increased during the preconditioning ischemia. During reperfusion following the preconditioning ischemia, coronary venous adenosine concentration returned back to baseline and tended to increase (n.s.) again at 5 min of the sustained ischemia. In group 3, the coronary venous adenosine concentration was already increased at 10 min after microembolization and remained increased during the subsequent sustained ischemia (Fig. 7).
Arterial and coronary venous adenosine concentrations. The arterial adenosine concentrations remained unchanged in all three groups. In group 1, the coronary venous adenosine concentration increased after the onset of the sustained ischemia. A similar increase is seen in group 2 during the preconditioning ischemia. During reperfusion following the preconditioning ischemia, coronary venous adenosine concentration dropped back to baseline and tended to increase (n.s.) with the onset of the sustained ischemia. With coronary microembolization (group 3), the coronary venous adenosine concentration was increased and remained elevated during the sustained ischemia (I5, I85: 5 and 85-min ischemia; IP: 10 min of preconditioning ischemia; IPRep: 15-min reperfusion after the preconditioning ischemia; ME: 10 min after coronary microembolization; *p<0.05 vs. arterial).
5. Discussion
5.1. Reduction of infarct size by ischemic preconditioning, but not by coronary microembolization
In the present study, we have transferred our dog model of coronary microembolization [2,3,7] to pigs. Also we confirmed that ischemic preconditioning by one cycle of 10-min ischemia and 15-min reperfusion reduces infarct size from subsequent 90 min sustained ischemia and 120 min of reperfusion [10,11]. In these prior studies, adenosine was identified as an important trigger of ischemic preconditioning. The interstitial adenosine concentration increased during reperfusion following the preconditioning ischemia [10,11], and protection was lost when adenosine was degraded by adenosine deaminase [11].
A similar finding was reported in a study by Grund et al. [5] where coronary microembolization prior to 45 min LAD occlusion increased infarct size in pigs to 84% compared to 60% in controls. Compared to the present study, the much greater increase in infarct size in the study by Grund et al. may be attributed to different experimental protocols. Grund et al. induced microembolization by injection of embolizing particles into the left atrium which results in microembolization of the entire heart, and subsequent sustained ischemia was induced by 45 min LAD occlusion. In our experimentsv the embolizing particles were injected directly into the LAD before a period of low-flow ischemia which resulted in a much smaller infarct size of 17.0±3.2% of the area at risk in controls. Thus, in the experiments by Grund et al., two factors may account for the pronounced increase in infarct size with microembolization. First, the entire heart was microembolized which affected also the border zone of the area at risk, and second, the more severe ischemia protocol results in much larger infarction per se.
In the present study, mean infarct size as such was not different between groups 1 and 3; however, the relationships between infarct size and subendocardial blood flow were different, indicating that this relationship may be a more sensitive endpoint of damage or protection of ischemic/reperfused myocardium. The small difference in mean infarct size between groups 1 and 3 is in a range similar to the infarct size induced by coronary microembolization per se, as derived from the four control experiments with coronary microembolization.
5.2. The role of vascular and interstitial adenosine in ischemia and cardioprotection
To investigate the role of adenosine with coronary microembolization, we measured adenosine concentrations in both the vascular and interstitial space. The high variation in coronary venous adenosine concentration at 5-min ischemia in group 1, during the preconditioning ischemia, and at 5 min sustained ischemia in group 2 can be attributed to the varying severity of the preconditioning or sustained ischemia, respectively. The observed increase in coronary blood flow after microembolization could again be attributed to the observed release of adenosine into the vasculature. Interestingly, the increase in coronary venous adenosine during the early sustained ischemia was attenuated by prior microembolization or ischemic preconditioning.
An increase in interstitial adenosine prior to the sustained ischemia is obviously necessary to induce myocardial protection, supporting its role as trigger [8]. The time course of changes in the interstitial adenosine concentration with ischemic preconditioning observed in the present study is consistent with a previous study [11]. The interstitial adenosine concentration remained unchanged after 10 min of microembolization. This lack of increase of interstitial adenosine shortly after microembolization is possibly attributed to an augmented washout of adenosine from the microembolized myocardium by the increased coronary blood flow in the adjacent microvasculature. With coronary microembolization, the interstitial adenosine increased only after the onset of the sustained ischemia and this increase during the sustained ischemia was attenuated. An attenuation of increases in the interstitial adenosine concentrations during the prolonged ischemia after ischemic preconditioning was reported for rabbits [16,17], pigs [18] and dogs [19] and was also observed in the present study. However, this attenuation of an increase of the interstitial adenosine concentration appears to be unrelated to a protective effect. In rabbits, either ischemic preconditioning or pharmacologic preconditioning by intravenous infusion of adenosine was able to reduce infarct size after prolonged ischemia but only ischemic preconditioning attenuated the increase in interstitial adenosine concentration during the prolonged ischemia [16]. An attenuation of the increase in the interstitial adenosine concentration during prolonged ischemia was also observed in rabbits after pretreatment with HOE 140 or 8-phenyl-theophylline which both blocked the infarct size-limiting effect of ischemic preconditioning [17]. Our current results further confirm that protection and attenuation of increase in interstitial adenosine during sustained ischemia are unrelated, since we observed an attenuated increase with either coronary microembolization, which was associated with a lack of protection, or ischemic preconditioning, which protected the myocardium by decreasing infarct size.
The return to baseline in the interstitial adenosine concentration in all groups during the late phase of the sustained ischemia may reflect the ongoing development of necrosis. Severely ischemic cells contribute most to the amount of interstitial adenosine, but these cells are also the first to undergo necrosis.
The different pattern of coronary venous and interstitial adenosine concentrations likely relates to their different sources; the interstitial adenosine largely reflects myocardial production and release, whereas coronary venous plasma adenosine is at least transiently and to a certain extent released from the endothelium [20]. Even at baseline, the interstitial adenosine concentration is about one magnitude higher than the coronary venous concentration, and with sustained ischemia, it is increased to an even greater extent. This difference probably not only reflects a diffusion gradient but also active uptake of adenosine by the endothelium [21]. In any case, if the coronary venous adenosine levels are assumed to reflect the levels in the vascular wall, the threshold for coronary vasomotor effects is considerably lower than that for myocardial/cardioprotective effects [22]. This could be due to the fact that the vascular wall contains a large receptor reserve for adenosine A2 receptors [23], whereas the potential protective effects of interstitial adenosine on cardiomyocytes are exerted through activation of adenosine A1 and A3 receptors [24].
5.3. Interaction of adenosine and TNFα
While the lack of increase in the interstitial adenosine concentration with coronary microembolization is a plausible explanation for the lack of protection from infarction, an alternative explanation relates to TNFα. TNFα is causally involved in the development of infarct size, since pretreatment with TNFα antibodies reduces infarct size in anesthetized rabbits [25]. Possibly therefore the increased TNFα levels counteracted the beneficial effects that might otherwise have resulted from coronary microembolization. On the other hand, TNFα is also involved in the mechanism of preconditioning. Pretreatment with TNFα mimics preconditioning in isolated rat hearts [26] and mice [27], and in TNFα knockout mice ischemic preconditioning is abrogated [27]. It is therefore possible that increasing levels of TNFα may protect the myocardium from infarction by sustained ischemia in a later phase following coronary microembolization, and this will have to be studied in future experiments.
We conclude that coronary microembolization does not protect the myocardium acutely from the consequences of subsequent sustained ischemia. The lack of protection against infarction is attributed to a failure of interstitial adenosine to increase with coronary microembolization.
References
Author notes
Time for primary review 15 days


